Your AI observability is answering a question your agents do not fail on
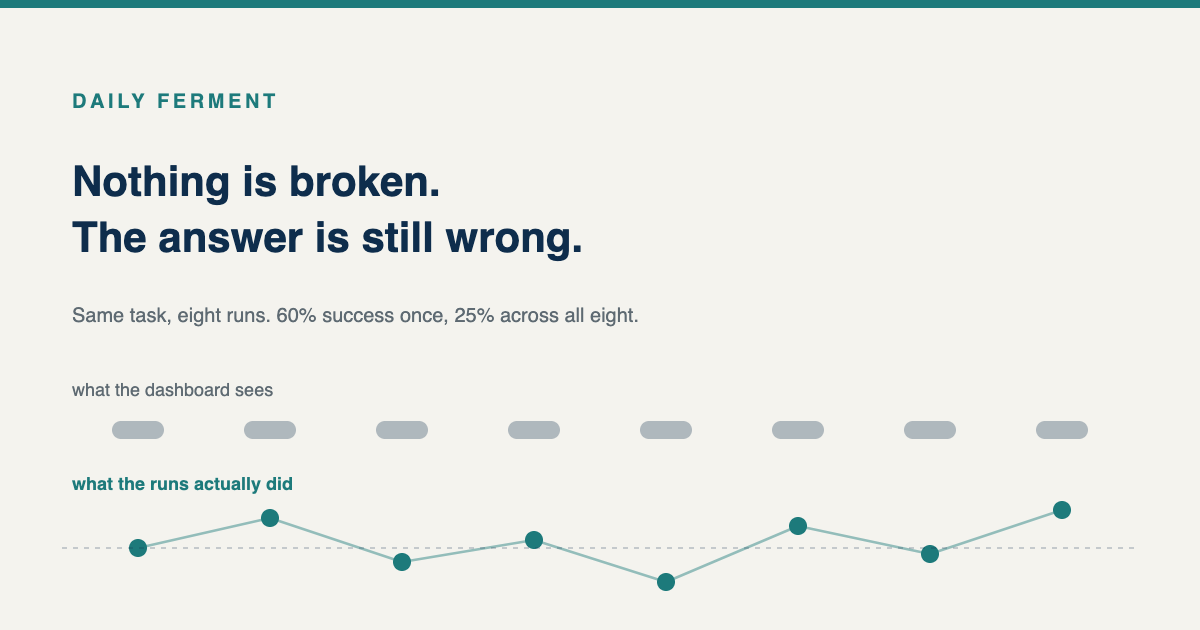
Agent performance drops from 60% on a single run to 25% across eight runs of the same task. Nothing errors, nothing times out, every trace is green, and the answer is wrong.
AI observability is currently the fastest-growing search term in my corner of the industry, up roughly 9,300%. So I went and read what the category actually promises, which took about an hour, because every result on the first page is a vendor explaining a product they sell.
They are all measuring roughly the same things, and they are all measuring them well. Prompts and responses. Token counts per call. Cost broken down by user, feature and model. Latency. Tool invocations and the order they fired in. Rate limits, timeouts, infinite loops, malformed structured output, content policy violations. Traces through every step of a multi-step chain.
That's a genuinely good list. It's also, as far as I can tell, beside the point.
The failure that actually kills these deployments is not an error
In a paper posted to arXiv in November 2025, Sushant Mehta reports a number that I have not been able to stop thinking about. Agent performance drops from 60% on a single run to 25% across eight runs of the same task. The 25% is not an average. It is the share of agents that stay successful across all eight.
Read that again with an operations head on. The thing works. Then you ask it to do the same job eight times, and three quarters of what looked like success stops being success.
Now ask what your observability stack saw while that happened.
No exception was thrown. No timeout. No rate limit. No malformed output, because the output parsed fine. Latency was normal. Token count was normal. Cost per call was normal. Every trace is green. The system is, by every signal the category measures, completely healthy.
And the answer is wrong, on a different 40% of runs each time.
What survives repetition
Agent success on the same task, single run versus eight consecutive runs
Succeeds when you run it once
Still succeeding across all eight runs
Sushant Mehta, arXiv:2511.14136, November 2025. Single-author preprint, not peer reviewed.
Observability was built to answer a question these systems do not fail on
The discipline comes from deterministic software, where the useful question is "is it broken". Metrics, logs and traces are extremely good at that question, because in deterministic software broken and working are distinct states and something crosses between them at an identifiable moment.
An agent is almost never broken. It's inconsistent. Those aren't the same condition and they don't have the same instruments.
To the credit of some of the vendors, a few say this out loud. PostHog's own write-up notes that "normal monitoring was built for software that does the same thing every time", and that LLM-as-judge evaluation is more expensive, less reliable, and sensitive to changes in the judging model. That is an honest description of a hard problem, and it sits inside a page selling the tool.
The gap is not that the tools are bad. It is that a green dashboard now means something much weaker than it used to, and the dashboard does not tell you that.
I should say that this observation is not mine. Prefactor published a piece in July making the same distinction, and making it well: observability records what the agent did, evaluation asks whether it did it well, and a span with status OK says nothing about whether the decision was correct. They cite Forrester putting rollback rates at 47% for agents without automated evaluation against 9% with full eval coverage, which is the clearest single argument for the distinction I have seen.
What evaluation coverage is worth
Share of deployed agents rolled back
No automated evaluation
Full evaluation coverage
Forrester, 2026, cited by Prefactor.
So the field is starting to say this out loud. What I have not seen anyone put next to it is how bad the consistency problem actually is, and what that implies for the two numbers everyone is already tracking.
There is a second number in that paper worth the same attention
Mehta also finds that optimising for accuracy alone produces agents 4.4 to 10.8 times more expensive than cost-aware alternatives with comparable performance.
Which means the cost tracking every observability product ships, cost per call, cost per user, cost per feature, is measuring the wrong denominator. The number that matters is cost per successful outcome, and almost nobody computes it, because computing it requires knowing which runs succeeded, which is the thing the stack cannot see.
You end up with beautiful cost dashboards attached to an unknown success rate. That isn't cost control. It's a well-instrumented guess.
The same mistake, in hiring
I hire engineers. I have run interview loops for years, and this is the same mistake I have watched good teams make, mine included.
An interview is a single run.
Somebody solves a problem in forty-five minutes under observation, and we record that as their ability. But the job is not one run. The job is the same class of problem, eight times a week, for two years, on days when they are tired, or the spec is vague, or the person who knows the system is on leave. We are selecting on a single-run score and then staffing a repeated-run process with it.
And the surprise afterwards is always the same shape as the agent surprise. Nobody's broken. Nothing failed. The work is just less reliable than the number we selected on suggested, and there is no incident to point at, which is exactly why it goes unaddressed for months.
The claim I will defend: when a process is variable, a single high-quality measurement of it is not a weak estimate of its reliability, it is an estimate of something else entirely. It measures the ceiling. Reliability lives in the spread, and you cannot recover a spread from one observation no matter how carefully you take it.
The instinctive fix, in the interview loop and in the eval suite alike, is to make the single measurement better. A longer interview, a more thorough evaluation, another panel round, a richer trace. That is precision applied to the wrong quantity. You don't need a better reading. You need more readings of the same thing under the same conditions, and you need to look at how much they disagree.
Engineers already have the vocabulary for this and do not connect it. A test that passes 60% of the time is a flaky test, and every team I have worked on treats flakiness as its own category of problem, with its own tooling, its own quarantine process, its own flake-rate metric. Nobody argues that a flaky test is 60% fine. An inconsistent agent is a flaky test that you shipped to customers, and almost nobody is measuring its flake rate.
What I would actually instrument
Run the same input repeatedly and record the disagreement rate between runs. That single number tells you more about whether you can deploy than any trace.
Track cost per successful outcome, not cost per call, which forces you to define success, which is the useful part.
Alert on variance shifts rather than on errors. A system whose disagreement rate moves from 15% to 30% has degraded badly and will not trip a single existing alarm.
And treat a green dashboard as evidence that nothing crashed, which is all it was ever evidence of, rather than evidence that the thing is working.
Marking my confidence
Established. The 60% to 25% consistency figures and the 4.4 to 10.8 times cost finding are as reported in Mehta's paper. The list of signals AI observability products capture is taken from the vendor documentation itself.
Worth flagging about that source. It's a single-author preprint on arXiv, not peer reviewed, and I found it cited elsewhere with the wrong institutional attribution, which is a reason to treat the exact figures as indicative rather than settled. I am relying on the direction and the size of the gap, not on 25% being precisely right. One paper is one paper.
Not original. The observability-is-not-evaluation argument was published by Prefactor in July 2026, before this piece, and they are an eval tooling vendor making it about their own category. The Forrester rollback figures are theirs. What I am adding is the consistency data, the cost-per-successful-outcome point, and the crossing below.
Inferred. That the selection failure in hiring and the evaluation failure in agent deployment are the same statistical error wearing different clothes. The mechanism is identical and both are consistent with it, but nobody has studied them together and I am reasoning by analogy.
Guess. That within about two years, consistency-under-repetition becomes a standard field in agent evaluation the way flake rate became standard in test suites, and that the first vendor to ship it as a default dashboard takes the category. I wouldn't put money on the timeline.
What would change my mind: replication showing the single-run to multi-run gap is much smaller on production workloads than on benchmarks, or a serious argument that run-to-run variance is adequately captured by something already in the standard stack.
Start with a loop and a counter
Before you buy anything, ask what question the tool answers. Most AI observability answers "did anything break". That question is worth answering and it isn't the one your agents are failing.
The one you need is "how often does it disagree with itself", and you can start answering that this afternoon with a loop and a counter.
This is the third time I have arrived here from a different direction. First a growth number with no control group. Then a volume number sizing the wrong system. Now a dashboard reporting health on a system that does not fail on health. The instrument keeps being the thing that is wrong, which is starting to look less like a coincidence and more like the subject.