Did climate change or El Niño do more to Hurricane Polo? It depends which number you read.
A rapid study says climate change did at least as much as El Niño to strengthen Hurricane Polo. Which did more depends on whether you read the intensity or the odds, and from which starting world.
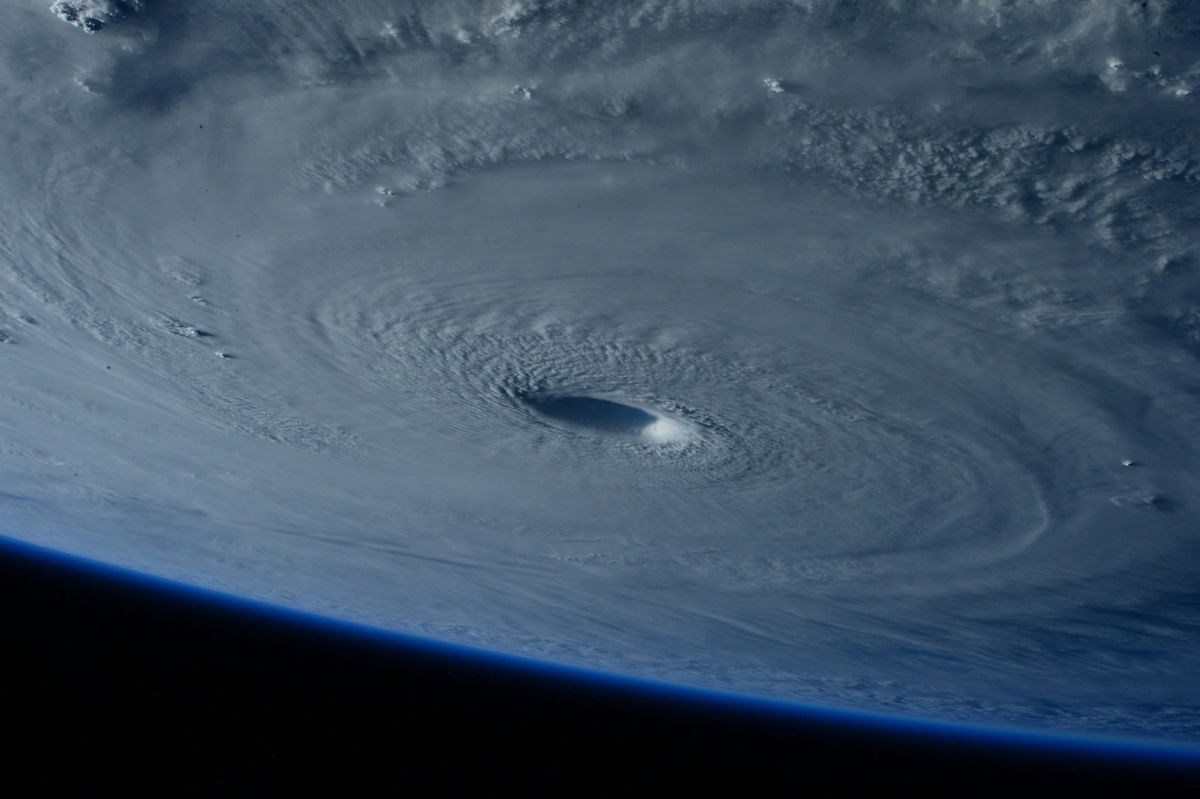
On 15 October World Weather Attribution and Climate Central published a rapid study of Hurricane Polo, which went from tropical depression on 20 September to Category 5 by 22 September off Mexico's Pacific coast and spent two and a half days at that strength, a Pacific record according to the AP. The headline finding: the "Effect of climate change at least as large as El Niño in strengthening Hurricane Polo." The numbers behind it are that the ocean conditions which let Polo get so strong were about 23 times as likely because of climate change, and about 14 times as likely because of El Niño.
Polo weakened before landfall and hit thinly populated coast. WWA's summary records four people killed in floods in Jalisco and one in Sonora, and about 1,000 people evacuated in New Mexico over fears for a dam.
So the question I'm working on is the one in the headline. When two things push the same storm at the same time, what does it mean to say one of them did more?
My first reaction was that 23 beats 14
That's what the coverage did too. Twenty-three is bigger than fourteen, so climate change wins.
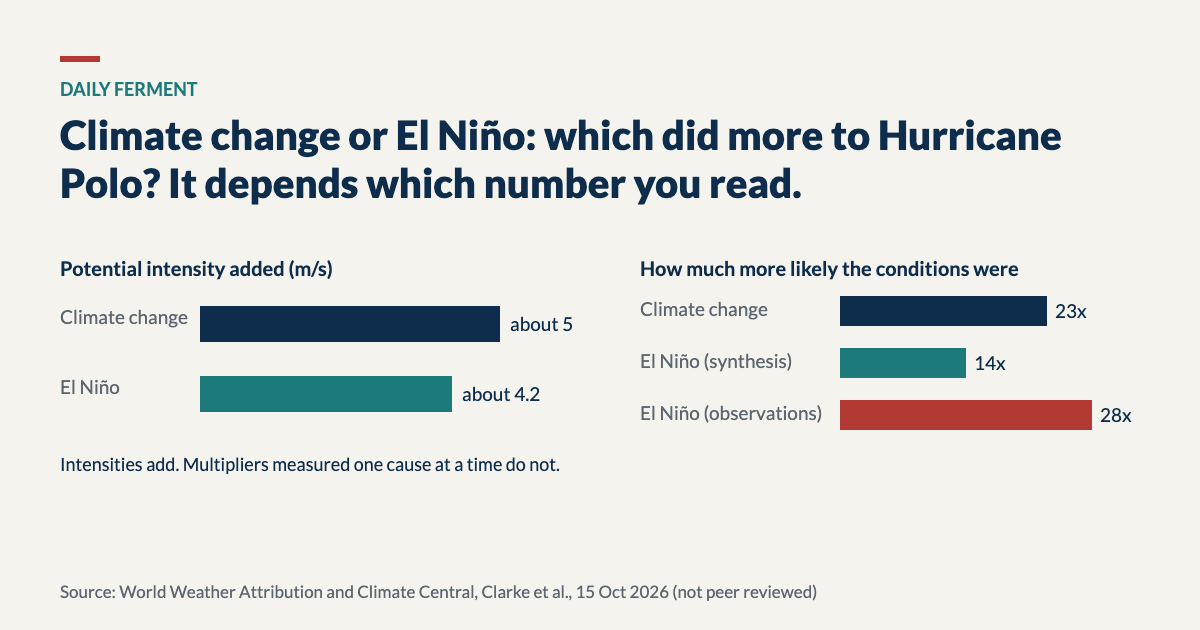
Then I read the report itself. In the main findings it says "the influence of El Niño is very strong, although smaller than the influence of climate change." In the conclusions it says El Niño amplified conditions "by a comparable degree to the influence of global warming." Those aren't the same claim. The El Niño figure also moves. The 14 is the synthesis of observations and models. The observations alone put it at about 28, which is higher than the 23 for climate change.
The intensity numbers tell a calmer story. Climate change raised Polo's potential intensity by roughly 5 metres per second; El Niño by roughly 4.2. In the AP's version, climate change added nearly 10 kilometres an hour to peak strength and El Niño about 8. Close, with climate change slightly ahead.
The method explains why the multipliers behave differently. The authors changed one factor at a time from where the world was in 2026. For climate change they varied global temperature "between its present and pre-industrial levels" with this year's El Niño left in place. For El Niño they varied it "between current El Niño and neutral conditions" with today's warmth left in place. So 23 answers "how much did warming matter, given this El Niño?" and 14 answers "how much did El Niño matter, given this much warming?" They're two questions asked from the same corner. Ranking them is less obvious than it looks.
The cross: how to split the cost of a runway
Economists hit the same problem with airports. A runway long enough for the biggest jet also serves every smaller plane. How much of its cost should each type of aircraft pay?
In 1973 S. C. Littlechild, then at the University of Aston in Birmingham, and G. Owen of Rice University published a short paper in Management Science showing that a simple rule already proposed for airport landing charges "generates precisely the Shapley value for an appropriately defined game." The rule goes like this. Split the cost of the shortest runway across every landing. Split the extra length the next aircraft type needs across that type and everything bigger. Keep going up. In the textbook example, runways costing 8, 11, 13 and 18 for four aircraft types give charges of 2, 3, 4 and 9, which add up to the 18 the airport actually spent.
The Shapley value behind it averages each player's contribution over every order in which the players could have arrived. That matters because order changes the answer. The second plane to arrive adds less than the first if it can share what the first one needed. Averaging over all orders is a way of agreeing in advance not to argue about who came first.
That's the point I'd take from the runway. Splitting a joint result between two causes isn't something you measure. It's a rule you choose, and a fair rule looks at the effect of each cause from more than one starting point.
Where the comparison breaks
A hurricane isn't a cost anyone agreed to share, and WWA wasn't trying to send anyone a bill. Its question was whether warming made this kind of storm more likely and stronger, and on that its answer is clear.
For intensity the runway problem mostly goes away. The report's model shifts potential intensity linearly with each factor, so the two contributions simply add, and roughly 5 against 4.2 metres per second is a fair split. The trouble is only with the multipliers. A storm condition that's rare sits in the tail of a distribution, where the same push changes the odds by different amounts depending on where you start. My guess is that El Niño's multiplier measured in a cooler, pre-industrial world would come out different from 14. The study didn't run that world, so I can't say which way.
Outside scientists quoted by the AP, including Jeff Masters and Michael Mann, think the study underestimates climate change's role, and Daniel Gilford, a co-author, said he was being conservative. The method also holds wind shear and the storm's track fixed, and El Niño's big effect in the Pacific is on wind shear. So the El Niño side may be understated too.
What that suggests
The ranking matters less than one sentence Friederike Otto gave the AP: "El Niño comes and goes, but climate change only gets worse." A comparable push from El Niño this year doesn't make the two causes equal for anyone planning a coastline. One of them will be back at the same strength or more every year.
When you next read that one cause "did more" than another for a storm, a flood or a heatwave, three checks help. Is the number an intensity, which adds, or an odds ratio, which doesn't? From which starting world was each cause removed? And does the report say the same thing in its findings and its conclusions? Polo's study passes the first, is clear on the second if you read the methods, and wobbles on the third.
I wrote about Gemini 4 Argon's 15% hallucination rate not being how often it's wrong, which was the same habit: a headline number that answers a narrower question than the headline. And rank trackers being fed fake results was about measuring in the right place before arguing about the result.
What I'm confident of, and what I'm not
The study's numbers, method and wording are established from the WWA summary and the scientific report, which hasn't been peer reviewed. That the two likelihood ratios answer different questions is inferred from the method, since each removes one factor with the other held at 2026 values. That a fuller split would change the ranking is a guess; the study didn't run it, and I'm not a climate scientist.
The claim, in one sentence: when two causes push the same event, "which did more" has no answer until someone picks a rule for splitting it, so read the intensity numbers, which add up, before the likelihood multipliers, which don't.
Sources
World Weather Attribution, "Effect of climate change at least as large as El Niño in strengthening Hurricane Polo", 15 October 2026. https://www.worldweatherattribution.org/effect-of-climate-change-at-least-as-large-as-el-nino-in-strengthening-hurricane-polo/
Clarke, B., Keeping, T., Gilford, D., Dahl, K., Cerezo-Mota, R. et al., scientific report, Imperial College London Spiral, 15 October 2026. https://spiral.imperial.ac.uk/handle/10044/1/144926
Angela Symons with AP, Euronews, "El Niño vs climate change: Which had more influence over the powerful Hurricane Polo?", 15 October 2026. https://www.euronews.com/2026/10/15/el-nino-vs-climate-change-which-had-more-influence-over-the-powerful-hurricane-polo
S. C. Littlechild and G. Owen, "A Simple Expression for the Shapley Value in a Special Case", Management Science 20(3), 370 to 372, 1973. https://ideas.repec.org/a/inm/ormnsc/v20y1973i3p370-372.html
Wikipedia, "Airport problem". https://en.wikipedia.org/wiki/Airport_problem